- 27 June 2019
- Posted by: Peter Lunio
- Categories: Analytics, Innovation, Operating Model, social housing, Uncategorized
Introduction
Becoming “data-driven” has been a commonly professed objective for many firms over the past decade or so. Whether their larger goal is to achieve digital transformation, “compete on analytics,” or become “AI-first,” embracing and successfully managing data in all its forms is an essential prerequisite. Consistent with these goals, companies have attempted to treat data as an important asset, evolve their cultures in a more data-oriented direction, and adjust their strategies to emphasise data and analytics.
This is being driven by a number of key trends
- Firstly, the amount of data we produce has been rapidly expanding and it’s predicted that by 2020 there will be 43 trillion gigabytes of data created – an increase of 300 times from 2005.
- On top of this, technology has been swiftly advancing and now the power of Business Intelligence (BI) and Analytics has made it possible to dissect complex data to draw meaningful results from it.
- And finally, and perhaps the greatest change of all, is the attitude towards data. Rather than simply being filed away in case of emergency, data is increasingly being recognised as a modern commodity and this is changing many organisations’ approach to what they do with their data.
So increasingly organisations are beginning to want to understand how good they are at using their data and how analytically mature they are vs their competitors. Below we have attempted to outline how an organisation can go about doing that.
What is Analytics Maturity?
Well, as the opportunities that data holds are opening up, organisations essentially have the choice as to what they do with the data that they produce, and this is exactly what analytics maturity refers to.
We can define analytics maturity as:
“The extent to which an organisation utilises the insights they create”
It attempts to ask “how much value/insights are you getting out of your data?”.
And an organisation’s answer to this question will determine their level of maturity.
The Stages of Analytics Maturity
We can think of analytics maturity as a journey. As you start to use more sophisticated techniques to analyse your data, you’ll start to progress in your analytics maturity journey.
The more an organisation use their data, the more analytically mature they are, and consequently the further along in the analytics maturity journey they are.
This means that an organisation that uses advanced BI & analytics software to analyse their data is considered to be far more mature than an organisation that relies solely on spreadsheets to carry out their reporting.
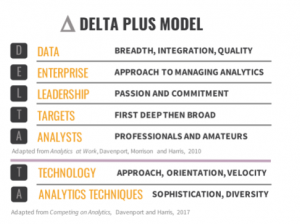
To help you identify how mature you are we use the DELTA model as devised by Davenport in his seminal paper “Competing on Analytics” recently updated in 2017.
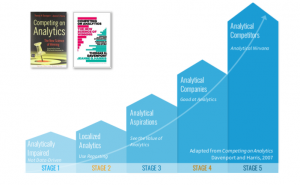
Five Stages of Analytics Maturity
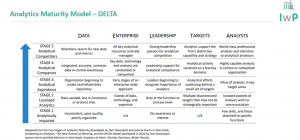
Organisations mature their analytical capabilities as they develop in the seven areas of DELTA . The maturity model, described in Competing on Analytics, helps companies measure their growth across the seven DELTA elements. This model enables an organisation to assess which elements are strengths and which are weaknesses. For example, an organisation may achieve stage 4 in analytics leadership maturity, but achieve only a stage 3 in its management and use of data. This assessment enables targeted investment to mature analytics weaknesses based on the DELTA Model.
STAGE 1– Analytically Impaired. These companies rely primarily on gut feel to make decisions, and they have no formal plans for becoming more analytical. They aren’t asking analytics questions and/or they lack the data to answer them. Their leaders may be unaware of analytics and what can be done with them Reporting is limited to tasks that are critical for business operations, with no formal BI & Analytics tools or standards in place to support this. Spreadsheets are generally used as a primary means of reporting.
STAGE 2 – Localised Analytics Analytics or reporting at these companies exist within silos. There is no means or structure for collaborating across organizational units or functions in the use of analytics. This often leads to “multiple versions of the truth” across a company.BI & Analytics are in their early stages of implementation and are used to report on activity across the business.
STAGE 3 –Analytical Aspirations. These companies see the value of analytics and intend to improve their capabilities for generating and using them. Thus far, however, they have made little progress in doing so. Using tools like scenario planning, BI & Analytics are used not just to report on what’s happening, but to plan for the future.
STAGE 4 – Analytical Companies. Companies in this category are good at multiple aspects of analytics. They are highly data-oriented, have analytical tools and make wide use of analytics with some coordination across the organization. However, there remains a lack of commitment to fully compete on analytics or use them strategically. Data Analytics is used to predict what will happen in 2/3 years from now and can even be used to pinpoint the key drivers of trends.
STAGE 5 – Analytical Competitors. These companies use analytics strategically and pervasively across the entire enterprise. They view their analytical capabilities as a competitive weapon, and they already have seen some competitive advantage result from analytics. Users no longer have to input variables into the system to predict future outcomes. Instead, Machine Learning and Artificial Intelligence make it possible to detect issues before they’re even considered.
See below a simplified version of the model, to assess your level of maturity.
Benefits of progressing in the Analytics Maturity Journey
Recent studies have revealed that data mature organisations that embraced analytics had a competitive advantage over their less mature counterparts. Here are some of the benefits they found and our own experiences.:
- Better enablement of key strategic initiatives – Did you know that data mature organisations are better equipped to reach their strategic goals? A survey by MIT and IBM* reported that organisations using more advanced analytics had 8% more sales growth, 24% higher operating income and 58% more sales per employee.
- Informed decision-making – Good decision-making is always driven by data. Data mature organisations are able to harness their data to make better-informed decisions. In our recent survey, we found that nearly half of all respondents reported that better decision-making was a key benefit of unlocking their data using analytics. Another 16% reported that its greatest benefit was in better enabling key strategic initiatives. Whilst nearly two-thirds of respondents said that analytics capabilities played an important role in driving business strategy.
- Understanding of customers and employees – Having advanced data insights means that data mature organisations can get into the heads of their customers and employees to understand what truly makes them click. Our neighbourhood analytics programme enables us to predict tenants that have a high probability to fall into arrears. A client had the issue of high management turnover which was leading to loss of income due to the reduced productivity and the cost of having to re-recruit. Using analytics, they were able to identify the key risk factors that ultimately led to employees wanting to leave and allowed them to put strategies in place to prevent this from happening.
- Ability to react to economic changes – Many organisations are at the peril of changing circumstances, having to simply make the best of a bad situation when it comes around. Having technologies like predictive analytics at their fingertips gives data to mature organisations the power to take a proactive approach to change rather than simply reacting to problems. This allows them to prepare for problems in advance and in some cases even prevent issues from occurring in the first place.
How to determine your level of Analytics Maturity
After working with organisations of all different shapes and sizes, we’ve identified the characteristics that define the various stages of the data journey.
Take our quick survey to find out what stage of the data journey you’re currently at and we will give you insights into the current state of your organisation.
https://docs.google.com/forms/d/e/1FAIpQLSeI87DqCAzlAheW8Cvw8qvSyZHlWmsECjZwoBUpdqv8RzepMA/viewform
*Forrester Global Business Technographics Marketing Survey 2016:
https://www.forrester.com/report/Global+Business+Technographics+Marketing+Survey+2016+Overview/-/E-RES137189
*IBM :
http://www-935.ibm.com/services/us/gbs/thoughtleadership/peopleequation/
*Nucleus Research :
https://nucleusresearch.com/research/single/analytics-pays-back-13-01-for-every-dollar-spent/