- 25 June 2018
- Posted by: Peter Lunio
- Categories: Analytics, regulator for social housing, RSH, social housing, Social Housing VfM Analysis, value for money
Over the past few years, both politicians and the national newspapers have made claims that the sector is not delivering VFM, and needs to up its game in this respect.
It is generally recognised within the sector that assessing and measuring VfM can, however, still be a challenge. Some elements, such as quality and sustainability, may be subjective, difficult to measure, intangible and misunderstood.
Therefore in an effort to simplify the measurement of VFM and steer associations towards building more homes and utilising its financial capacity, the RSH has come up with a set of metrics which simplifies the measurement of VFM in the sector.
So to try and answer the above question, here at Insights for Purpose ( IwP) we have undertaken an analysis based on the new suite of VFM metrics.
From these metrics, we have devised a VFM tracker. So this enables us to develop a single score for each English housing association based upon the performance of each of the new VFM metrics.
Using the tracker we have looked at the historical performance and, utilising our unique IwP Methalytics predictive algorithm, we have forecasted each association’s future performance.
For this analysis, we will only show the results of our analysis based on a segmentation of the sector based on size ie units and type ( traditional, LSVT).
So is the Sector Delivering VFM?
Our first piece of analysis is a five-year average VFM score for each housing association in our database.
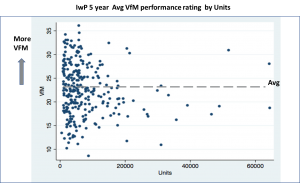
This scatter diagram of all the English housing associations shows that there is a substantial distribution of VFM scores across the sector. Ranging from a score of 10 to 35. So does that reflect the diverse nature of the sector?
Conclusion – It appears to indicate that the larger associations do not necessarily deliver VFM based on these limited metrics. There are more of the larger associations below the average line than above.
Does Size make a Difference?
The next piece of analysis is an eight-year trend analysis of our VFM tracker by association size (units) which has five years historical actual data and then our three years predicted performance. We have split the sector into four, based on size. See figure below. You can see that the larger associations ( >20k units) are the worse performing group with a decline of 12% over the period, and our prediction is that they will continue to perform poorly relative to the sector.
![]()
The most consistently performing group are the 10k-3k associations which have shown an increase in 4% over the period and the most improved are the 20k-10k associations.
The smaller associations >3K are showing a decline of 6% over the period. What is also interesting is that the VFM performance gap between the best and lowest in FY2017 is a sizable 20%.
Conclusion. This again suggests that the larger associations deliver less VFM than the medium size associations and the 10k-3k group are the most consistent performers. The analysis suggests that size does make a difference.
Does Type make a difference?
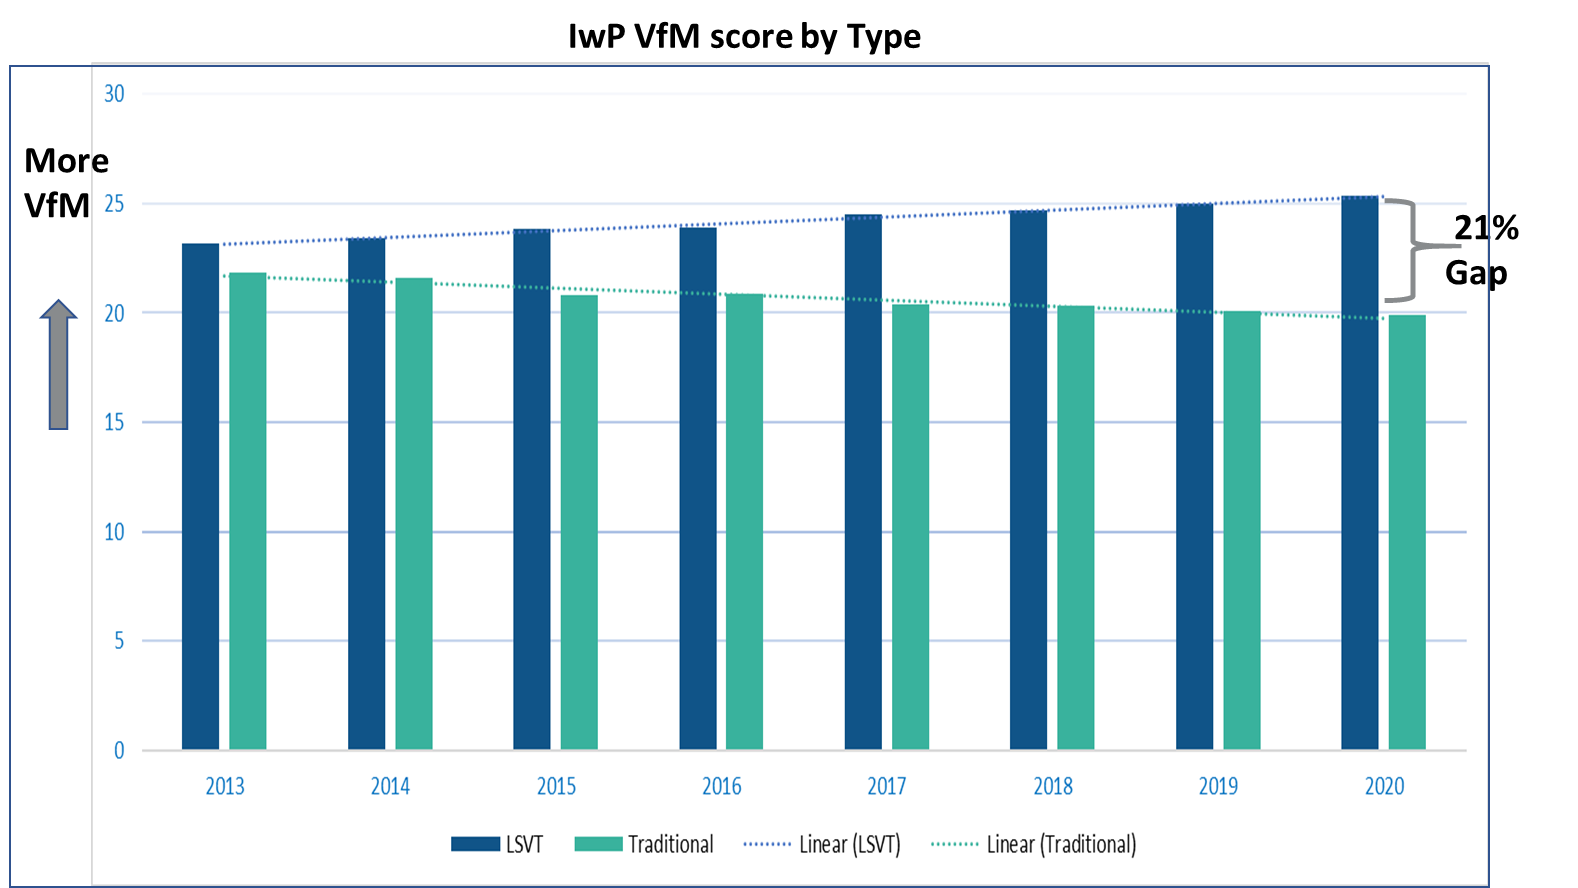
The next piece of analysis is by type, ie whether an association is a traditional or an LSVT etc. We have utilised our VFM tracker again and examined the performance of the different types of associations. The results show (see below) that the best performing groups are the LSVT’s. Though as you can see, the most volatile has been the LSVT<7 years.
![]()
The traditionals, however, have consistently underperformed compared to the other groups, and we are predicting that they will continue to do so. Again the performance gap is quite sizeable at 23% between traditional and LSVT’s
The conclusion in terms of VFM by type is that the LSVTs, in particular, the more mature ones, ie LSVT>12 years, appear to be the better performing group. Our prediction (see graph above) is that LSVT group will continue to have a significant VFM performance gap over traditionals. The analysis, therefore, suggests that type does make a difference.
Based on this analysis the sector group that has consistently delivered, and we predict will continue to deliver VFM relative to the sector, are those associations that are between 10k-3k units in size and are LSVTs>12 years, of which there are only 62 associations who fit into this segment. They represent 22% of the overall sector.
Based on our VFM rating scheme we have ranked each individual English association based on their average historical VFM performance. If you would like to know where your association stands in our Platinum/Gold/Siver/Bronze ranking, then fill in your details below.
If you would like a copy of our free guide on IwP 2018 VFM Standards Guide & Performance Analysis which includes the analysis above then fill in your details below and we will send you a copy.
If you would like to know how your association performs in relation to VfM and our other unique performance trackers on Business Health, Cost Efficiency, Staff Productivity and our Overall Performance Rating of your Association then please go to our website or contact me directly.
© 2018 IwP All Rights Reserved