- 18 October 2018
- Posted by: Peter Lunio
- Categories: Business plans, Finance & accounting, Operating Model, regulator for social housing, RSH, social housing, Social Housing VfM Analysis, value for money
Over the past few years, there has been significant cost emphasis in the sector as a result of the 1% rent reduction and focus by the regulator. We have seen a number of associations employ an across-the-board approach to cost reduction because it is fast, relatively easy, and appears “fair” to organisational units and other stakeholders. Nonetheless, our experience and our research suggest that a targeted approach is both more effective and more likely to be sustainable.
Or view is that “A diet helps you lose weight for a while; a lifestyle change makes you healthy”
So we thought we would try and examine how the sector has approach cost performance. We have therefore use the sector key cost performance metric Cost Per Unit ( CPU) and, utilising our unique IwP Methalytics predictive algorithm, we have forecasted each association’s future performance.
For this analysis, we will only show the results of our analysis based on a segmentation of the sector based on size i.e. units and type (traditional, LSVT).
Using our IwP Housing Performance Database, (http://iwp-uk.com/services/cost-efficiency/) we are predicting that if social housing providers could match their most improved counterparts, they could collectively save an additional £400m or 8% (avg £1.4m per association) while maintaining today’s levels of service quality based on 2017 data.
Now we recognise that this is a theoretical number and that there are a number of significant factors that mean this may not be achievable. But here at IwP we were intrigued as to what may be possible.
So, is the Sector Cost Efficient?
Our first piece of analysis is a five-year average CPU score for each housing association in our database.
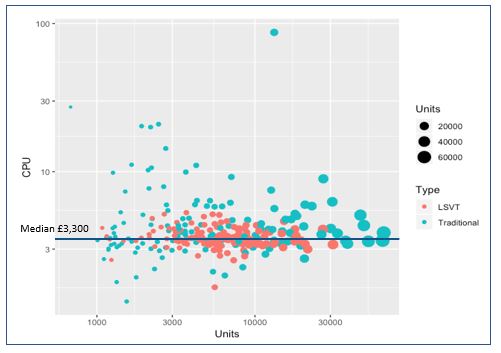
This scatter diagram of all the English housing associations shows that there is a substantial distribution of CPU across the sector. Ranging from £0.97 to £48 for 2017, with a median at £3,300. You can see from the scatter diagramme that there are more Traditional with higher CPU than LSVT’s and that some of the larger association CPU are not necessarily the lowest. Though we do recognise that some of the outliers are providers of supported housing or housing for older people which tend to have higher CPU.
The regulators own analysis shows that the Headline social housing cost changes from 2015-2017 show the pressure on rental income in recent years has also led most associations to drive down costs and seek operational efficiencies. Between 2015 and 2017 the average (median) headline social housing cost has reduced by 6.4% from £4,040 to £3,780 per unit. ( Source: RSH VFM Report Oct 18). We have calculated that this equates to approximately £290m or around £1m per housing association over the two years. The question is this a quick fix are these reductions sustainable? More on that later
Insight – What is interesting is that though there are more Traditionals with higher CPU than LSVT there are also quite a few Traditionals with much lower CPU. So maybe it does not follow that if you are a Traditional that you have a higher CPU???
Does Size make a Difference?
The next piece of analysis is an eight-year trend analysis of CPU by association size (units) which has five years historical actual data and then our three years predicted performance. We have split the sector into four, based on size. See the figure below.
![]()
You can see that the smaller associations (<3k units) are the worst performing group with an increase over the period, and our prediction is that their CPU will continue to rise. We are predicting that this groups CPU will have increased by 16% since 2013. More worrying is the >20K units whose CPU appears to have flatlined, we are predicting a drop in CPU by only 2% from 2013. The best performing group are the 10k-3k and 10k-20k associations which have shown decreases of 34% and 22% respectively.
The gap between the highest CPU group and the lowest is currently 42% and again worryingly we are predicting that this will widen.
Also, if you dig further into the numbers the consequences of the trends highlighted above are as follows. In absolute costs terms, we have estimated that since 2015-17 for the >20k group costs have increased by £303m or £14m per association. Contrast that with the 20k-10k, 10k-3k and <3k whose absolute costs have fallen by £272m, £370m and £16m respectively ( Avg per association of £6m, £2.5m and £0.2m) over the period. It is clear that for some associations CPU reductions have not matched their corresponding increases in units.
Insight. It appears from this analysis that the medium size associations (10k-3k, 10k-20K) are making great strides in decreasing their CPU and absolute costs. Which is not matched by the very larger and smaller associations. Our prediction is therefore that 10-20k and the 3k-10k cohorts are going to continue to deliver sustainable cost reductions but not the larger (>20k) or smaller (<3k) cohorts. This is supported by the evidence that in actual cost terms the 10-20k, 3k-10k and <3k group have reduced their costs by 12%, 14% and 3% whilst >20k group have seen their cost increase by 10% since 2015. Overall we have estimated that the sector has delivered a £356m saving over the period.
Does Type make a difference?
The next piece of analysis is by type, i.e. whether an association is a traditional or an LSVT etc. We have examined the performance of the different types of associations. The results show (see below) that the best performing groups are the LSVT’s>12 yrs.
![]()
Though as you can see, that most of the LSVT groups have made significant progress. With each of the three types of LSVTs showing a 20%+ decline in the period in question. As per our VFM analysis Traditionals, are underperforming in comparison with their LSVT peers, and we are predicting that they will continue to do so. Again, the performance gap is quite sizeable at 39% between traditional and LSVT’s.
![]()
Again, if you dig further into the numbers the consequences of the trends highlighted above are as follows. In absolute costs terms, we have estimated that since 2015-17 for the Traditional group costs have increased by £402m or £3m per association. Contrast that with the LSVT <7yrs, 7-12yrs, and >12yrs, whose absolute costs have fallen by £63m, £192m, and £102m respectively ( Avg per association of £6m, £4m and £1m) over the period.
Insight in terms of CPU by type the LSVTs, in particular, the more mature ones, i.e. LSVT>12 years, appear to be making significant reductions in their CPU. Our prediction (see graph above) is that LSVT group will continue to have a significant CPU performance gap over Traditional. We have estimated in absolute cost terms that LSVT <7yrs, 7-12yrs, >12yrs, have delivered reductions of 31%, 24% and 5% in absolute costs whilst Traditional have increased their costs by 6% in the period 2015-17. The analysis, therefore, suggests that type does make a difference and that LSVTs are delivering greater sustainable reductions.
Cost Drivers
The key drivers in the general reductions in CPU certainly since 2015 have been major repairs and management costs which appears to fit in with the rent reduction impact.
![]()
Over the period since 2013, the long-term trends have been a 36% reduction in Major repairs CPU followed by a 27% reduction in Other Social housing costs. Though it is interesting to see how this has accelerated since the year of the rent cut in 2015. With a 27% reduction in major repairs, a 10% reduction in management and 7% in maintenance. Whilst Service Charge and Other have gone up by 10% in the same period.
We wonder if this is an indication of a sector taking short-term cost reduction approach i.e. “how do we spend the money ” as opposed to a more fundamental “how do we do business approach”
| Average of Management CPU | Average of Service Charge CPU | Average of Maintenance CPU | Average of Major Repairs CPU | Average of Other social housing costs CPU |
| -2% | 10% | -7% | -36% | -27% |
Operating Margin
Finally, we have looked at the correlation between operating margin and CPU see diagram below based on 5 years’ worth of data.
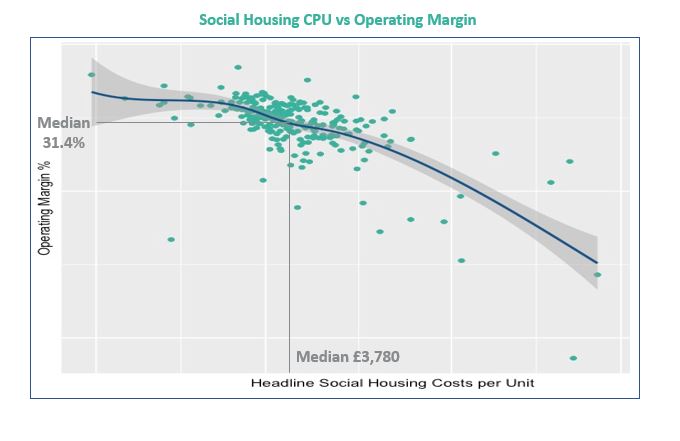
What it shows as you would expect that there is a very strong correlation between Operating margin and CPU. Clearly, there is a large cluster around the median CPU of £3,780, and a margin of 31.4%. Because of this strong correlation, we are able to make some predictions based around an expected margin see table below.
| CPU Quartiles | Avg Actual Margin | Expected Margin |
| 1st Quartile – £2,880 | 35% | 32.4% |
| 2nd Quartile – £3,300 | 26% | 31.8% |
| 3rd Quartile – £4,090 | 27% | 30.1% |
So, for instance, if you look at the first quartile CPU of £2,880, our model predicts that the expected margin should be around 32.4% that avg actual is 35% which means that these organisations are outperforming what would be expected. If you look at 2nd Quartile CPU of £,3,300 then we would expect associations to have a margin of around 31.8% but the avg actuals are 26% which suggest that those associations in this group are potentially underperforming. We do appreciate that this is a very rough and ready benchmark but provides a reasonable rule of thumb for exec teams/boards given the strong correlation between the two variables.
Insights. What can quite confidently say as a rule of thumb that a decrease in CPU by £1000 should on average increase your margin by 1%, Though you should note that LSVT and Traditional associations respond differently in our expected margin model to decreases in CPU, with LSVT’s having a much larger increase in operating margin per reduction in CPU. The model also enables us to predict an association’s expected margin based on their CPU and vice versa.
In Conclusion
The LSVT associations appear to be significantly outperforming their Traditional peers in relation to CPU reduction, as well as the <3 and >20k units’ group of associations
Based on this analysis the sector groups that appears to deliver on CPU, and we predict will continue to deliver relative to the sector, are those associations that are between 10k-3k units in size and are LSVTs 7-12 years, of which there are only 34 associations who fit into this segment. They represent 12% of the overall sector. It is also clear that though there have been reductions across the board in CPU, this is not always kept pace with increases in units and therefore for some groups, absolute costs have risen!
Our general advice to executive teams and boards is that
The focus should be on making a more leaner and flexible organisation with cost reduction as a consequence not necessarily just the target.
If you would like to know your association expected operating margin relation to your CPU or vice versa or how your association performs against our unique performance trackers on Business Health, Cost Efficiency, Staff Productivity and our Overall Performance Rating of your Association then please go to our website or contact me directly.